How the Atlanta Fed uses Economic Surveys to Inform Monetary Policy
01/11/2024
Kevin Foster, Federal Reserve Bank of Atlanta
Surveys play an important role in monetary policy decision-making in the Federal Reserve System. While Fed policy makers have always relied on surveys conducted by federal statistical agencies, more recently, they are relying on surveys conducted by their own Fed staff. These internally administered surveys have the advantages of being highly predictive, timely, and nimble.
The Federal Reserve Bank of Atlanta runs two monthly economic surveys which provide direct input into monetary policy decision making. The Business Inflation Expectations (BIE) survey interviews around 230 business leaders in the Atlanta Fed’s district, which covers Georgia, Florida, and Alabama, and parts of Louisiana, Mississippi, and Tennessee. The Survey of Business Uncertainty (SBU) interviews about 620 business leaders around the United States and is run in partnership with economists at Stanford University.
The BIE has been measuring firm’s inflation expectations since October 2011. The survey consists of four core questions, three rotating quarterly questions, and several special questions each month. Instead of eliciting expectations for some notion of “aggregate” inflation—such as the Consumer Price Index (CPI)—the BIE elicits business decision makers’ views on their own-firm unit cost growth over the past 12 months, and then asks them to give a probability distribution for five predefined outcomes of expected changes in their own-firm unit costs over the next 12 months. Unit cost is defined as the cost per unit sold of goods produced or services provided by the firm.
After aggregating all responses, firms’ realized unit cost growth closely tracks the broadest measure of inflation in the U.S.—the GDP Chain-type Price Index. Indeed, the two data series in Figure 1 have a correlation of 0.96. Additionally, the advantage of the BIE is that our data is monthly, and released no later than the 16th of the month, while the GDP data are quarterly and released almost two months after the quarter ends. The accuracy of the realized cost growth measure strengthens the reliability of firms’ year-ahead unit-cost expectations. These expectations offer unique insight into how price-setters in the economy are anticipating future inflationary pressures to unfold, and thus have value in both understanding near-term inflation dynamics and in forecasting inflation.
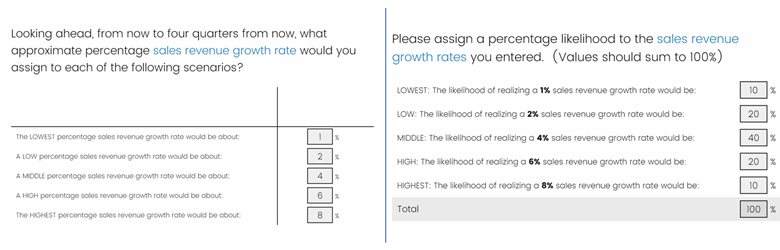
The SBU extends the methodology of the BIE to fully-flexible probabilistic expectations over own-firm sales revenue and employment growth—by asking firms to fill out quantitative estimates for five potential scenarios ranging from “highest-case” to “lowest-case” growth rates before asking them to provide probabilities for each scenario. Figure 2 shows screenshots of the two-part question from the SBU sales survey. . We then aggregate over all the forecast distributions to create monthly indices of expectations (the first moment) and uncertainty (second moment) for both outcomes. As with the BIE, the SBU allows space for monthly special questions.
The Atlanta Fed surveys are flexible and nimble in ways that many government surveys cannot be. Fed officials meet every six to eight weeks to set monetary policy, and they need timely data. Our monthly surveys provide important insight into economic conditions on the ground, in near real time. Examples of real-time special questions include measuring the impact of COVID-19 on firms, the bank failures of March 2023, and wars in Europe and the Middle East, all within days of these events occurring.
The results of our surveys are used directly by Raphael Bostic, the president and CEO of the Atlanta Fed, as he prepares to make monetary policy decisions at FOMC meetings. In several speeches and public statements, President Bostic has mentioned how much he values the insights he gains from the BIE and the SBU. It is with President Bostic’s words in mind that the Atlanta Fed survey staff continues to produce monthly estimates of business uncertainty and inflation expectations.
Figure 1 –The measures of BIE year-over-year realized cost growth and GDP Chain-type Price Index are highly correlated.
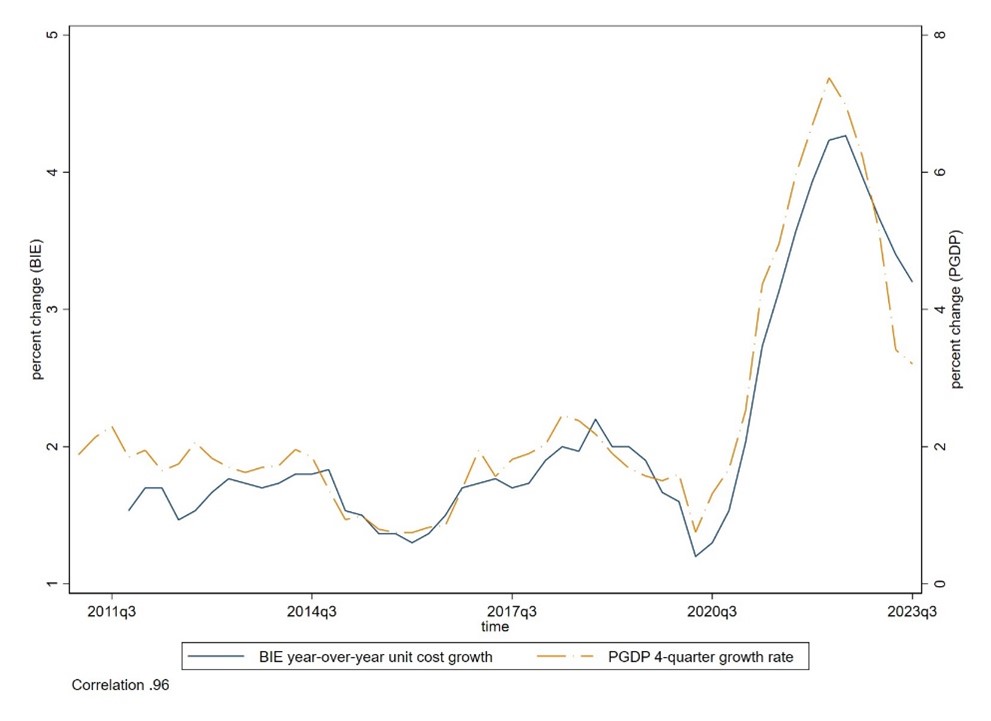
Sources: Bureau of Economic Analysis; FRB Atlanta Business Inflation Expectations (BIE) Survey.
Notes: The sample period begins in 2011q3 and ends in 2022q3. The BIE series are weighted by industry-share of GDP and quarterly averages are plotted. Given the nature of the panel, the most apt comparison is to the broadest notion of overall inflation (i.e. GDP price index). The BIE series is plotted on the left axis and the GDP Price Index is plotted on the right axis.
Figure 2 – Screenshot of SBU questions. In the left panel, respondents enter five scenario-based outcomes, and in the right panel, they assign probabilities to those outcomes.